-
Bug
-
Resolution: Unresolved
-
None
-
1.20.4, 24w13a
-
None
-
Confirmed
-
UI
The bug
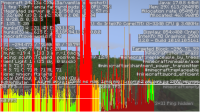
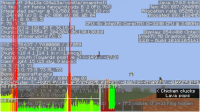
If performance is sufficiently low, the F3+2 graphs can exceed the upper boundary of the window, making their true values impossible to see. This also results in other debug information being obscured as a result, making this a considerable accessibility/usability issue.
How to fix
This graph already seems to be using a log scale of some sort, but if not, this could be used to reduce extreme heights while still maintaining readability.
If a bar in the graph exceeds a certain height, it could possibly loop around to the bottom with a different color than it otherwise would have. Perhaps instead of coloring these bars simply based on their height, what is currently shown would always be green, but if it reaches twice the height of the 30fps line, it could repeat from the bottom as a yellow bar, then as orange, then red?

